
Key Takeaways
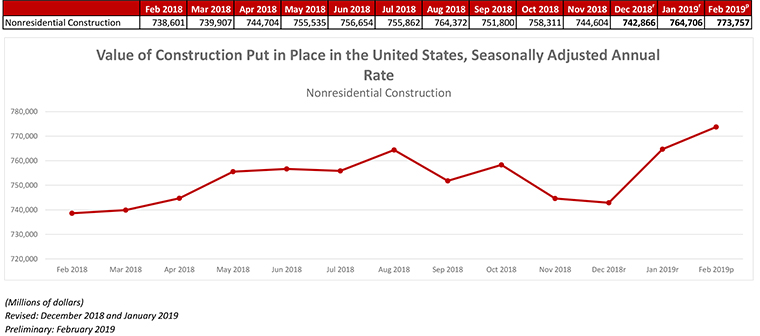
- Nonresidential construction spending, which totaled $773.8 billion on a seasonally adjusted annual basis for February, was a 4.8% increase over the same time last year.
- Private nonresidential spending fell 0.5 percent for the month and is only up 0.1 percent on a year-over-year basis.
- Public nonresidential spending is up 3.7 percent for the month and an impressive 12.1 percent for the year.
Press Release from Associated Builders and Contractors, Inc.
WASHINGTON, April 1—According to an Associated Builders and Contractors analysis of U.S. Census Bureau data released today, national nonresidential construction spending rose 1.2 percent in February. Seasonally adjusted nonresidential spending totaled $773.8 billion, a 4.8 percent increase over the same time last year.
Private nonresidential spending fell 0.5 percent for the month and is only up 0.1 percent on a year-over-year basis. Public nonresidential spending is up 3.7 percent for the month and an impressive 12.1 percent for the year. Highway and street (+9.6 percent), water supply (+5.2 percent) and sewage and waste disposal (+5 percent) spending experienced the largest monthly increases in February, while religious (-4 percent) and transportation (-3.8 percent) spending experienced the largest decreases.
“A number of economic readings have come in weaker than expected of late, including retail sales and February employment,” said ABC Chief Economist Anirban Basu. “Now private nonresidential construction has effectively flatlined during the past year, with spending virtually unchanged on a year-ago basis despite higher materials costs. This suggests that the actual physical amount of construction put in place has declined in real terms during the past year.
“As is often the case, it’s tempting to blame the weather,” said Basu. “It is absolutely true that the upper Midwest and New England were hit hard by precipitation and bitterly cold temperatures this winter, which undoubtedly suppressed some level of activity. However, softer growth in private nonresidential construction has been apparent for months. This is not a new phenomenon. Spending in the office, commercial and lodging categories was flat to declining in February.
“By contrast, public nonresidential construction spending was up sharply,” said Basu. “This strongly suggests that there is more at work than weather in terms of factors shaping the data. State and local government finances have continued to improve as the broader economy has expanded. America has generated job growth for 101 consecutive months, which has helped push income tax collections higher and unemployment insurance payments lower. Property values also have risen, as have sales tax collections.
“The standout is the highway and street category, which has experienced nearly 23 percent growth in spending on a year-over-year basis,” Basu added. “Policymakers also have been paying considerable attention to flood control (with conservation and development up 19 percent year over year) and water systems (with water supply up nearly 12 percent).”
Press Release from Associated General Contractors of America
Construction Spending Increases 1% from January to February; Industry Adds Jobs in 232 out of 358 Metro Areas Since February 2018
Phoenix-Mesa-Scottsdale and Monroe, Mich. Have Largest Gains While Anaheim-Santa Ana-Irvine, Calif. and Danville, Ill. Have Biggest Losses; Association Calls for Expanded Career Training Programs
Construction spending increased by 1.0 percent from January to February, while construction employment increased compared to February 2018 levels in 275 out of 358 metro areas, according to an analysis of new government data today by the Associated General Contractors. Association officials called on federal officials to support more career and technical education programs to prepare workers for in-demand careers like construction.
“The spending increase in February follows an extremely strong 2.5 percent gain in January, which aligns with contractors’ reports that they were busy early in the year and expect to stay that way through 2019,” said Ken Simonson, the association’s chief economist. “The major challenge they face is finding enough workers.”
Construction spending totaled $1.32 trillion in February, up 1.0 percent from the January rate and a gain of 1.1 percent compared to February 2018. Public construction accounted for the bulk of the monthly and annual increases, while private categories were mixed, the economist noted. Public construction spending jumped 3.6 percent for the month and 11.5 percent year-over-year. The largest public category, highway and street construction, soared 22.8 percent from a year ago. Educational construction, the next-largest segment, rose 5.5 percent year-over-year.
Private nonresidential spending slipped 0.5 percent for the month and inched up 0.1 percent from a year ago, while Residential spending climbed 0.7 percent from January to February but declined 3.4 percent from February 2018. Among the largest private nonresidential segments, power construction (electric power plus oil and gas field and pipeline projects) gained 1.4 percent year-over-year; commercial construction (retail, warehouse and farm structures) declined 6.6 percent; manufacturing construction increased 3.4 percent; and office construction rose 4.8 percent. Among residential segments, new multifamily construction spending rose 7.5 percent year-over-year but new single-family construction spending decreased by 7.1 percent, while improvements slipped 1.5 percent.
Construction employment grew in 232, or 65 percent, out of 358 metro areas between February 2018 and February 2019, declined in 73 (20 percent) and was unchanged in 53, according to a new analysis of federal employment data the association released today. Industry employment set a new high for February in 62 metro areas and a new low, in records that date back to 1990 for most metros.
The Phoenix-Mesa-Scottsdale, Ariz. metro area added the most construction jobs during the past year (11,900 jobs, 10 percent), followed by Atlanta-Sandy Springs-Roswell, Ga. (9,700 jobs, 8 percent) and Dallas-Plano-Irving, Texas (7,600 jobs, 5 percent). The largest percentage gain occurred in Monroe, Mich. (28 percent, 500 jobs), followed by St. Cloud, Minn. (19 percent, 1,000 jobs) and Chico, Calif. (18 percent, 700 jobs).
The largest job losses between February 2018 and February 2019 occurred in Anaheim-Santa Ana-Irvine, Calif. (-3,300 jobs, -3 percent), followed by San Jose-Sunnyvale-Santa Clara, Calif. (-2,600 jobs, -6 percent) and Riverside-San Bernardino-Ontario, Calif. (-2,500 jobs, -2 percent). The largest percentage decrease took place in Danville, Ill. (-20 percent, -100 jobs), followed by Niles-Benton Harbor, Mich. (-17 percent, -400 jobs).
Association officials said contractors in many metros can’t find enough trained workers and they urged federal officials to invest more in career and technical education. They warned firms may be unable to satisfy rising demand for construction unless more young adults are exposed to, and consider pursuing, high-paying construction careers.
“Contractors nationwide report difficulty finding enough workers to keep pace with the strong demand for projects,” said Stephen E. Sandherr, the association’s chief executive officer. “Expanding high school career and technical education programs will expose students to the rewarding career paths offered by high-paying construction jobs.”